| |
|
|
Ultrasound examination of the venae cavae |

|

|
|
Wednesday, 06 September 2006 |
This chapter’s subject is covered in a paper published in Intensive Care Medicine (Intensive Care Med 2006; 134: 203-206). Some figures are reproduced with permission. There are two vena cavae in humans. The superior vena cava (SVC) is formed by the junction of the right and left brachiocephalic veins, crosses the pericardium, and empties into the top of the right atrium. The inferior vena cava (IVC) is formed by the convergence of the right and left iliac veins, crosses the diaphragm, and empties into the bottom of the right atrium. The SVC is an intrathoracic vessel, whereas the IVC is essentially intraabdominal, with a short, practically notional intrathoracic course. The two venae cavae supply the venous return to the right heart: about 25% from the SVC and 75% from the IVC (1,2).
Superior vena cava Echocardiography of the SVC can be done by a transesophageal approach (figures 1 and 2) (3). 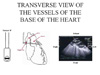
| Figure 1: Transesophageal echocardiography transverse view of the vessels of the base of the heart, through the superior vena cava (SVC). PA: pulmonary artery | 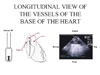
| Figure 2 : Longitudinal view of the vessels of the base of the heart, obtained from the transverse view (figure 1) by turning the probe sensor through 90°. This view is used to study respiratory variations in SVC. PA: pulmonary artery |
To remain open, this collapsible vessel must be subject to a distension pressure higher than the critical closing pressure. In a mechanically ventilated patient, the inspiratory phase raises the right atrial pressure less than the pleural pressure (figure 3). 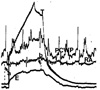
| Figure 3: Simultaneous recording of tracheal pressure (T), pulmonary capillary wedge pressure (PCWP), right atrial (RA) pressure, and esophageal (E) pressure (permitting measurement of pleural pressure). During the inspiration phase, the pleural pressure rises more than the right atrial pressure (or central venous pressure), producing an inspiratory decrease in distension pressure (shown by an arrow). |
As a result, the difference between these two pressures, the SVC distension pressure, decreases in the inspiratory phase of assisted respiration and may become insufficient to keep the SVC open in a hypovolemic patient (figure 4, films 1, 2, 3). 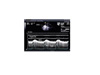
| Figure 4: Partial collapse of the SVC seen on a longitudinal view recorded using two-dimensional and M-mode echocardiography. This recording was made in a mechanically ventilated patient with circulatory insufficiency and suggests the presence of hypovolemia. AP: airway pressure; PA: pulmonary artery. |
Because of an increase in pleural pressure, the SVC behaves like a Starling resistor, and the influence of the external pressure on its diameter is determined by the zone conditions (figure 5). 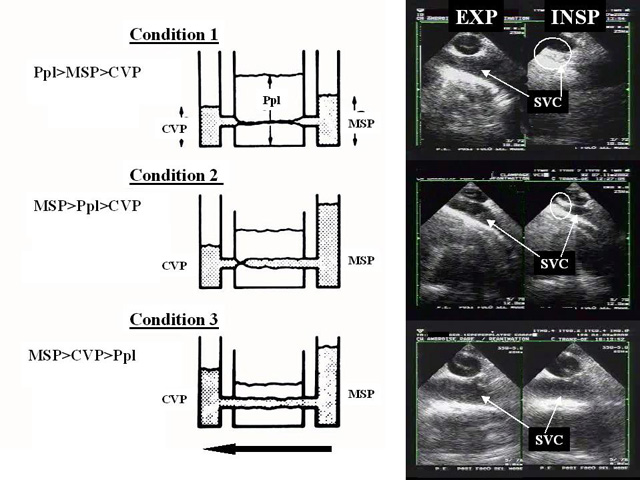
| Figure 5: Left: schematic representation of the SVC as a “Starling resistor’’, with an inflow pressure (mean systemic pressure of the upper part of the body, MSP), an outflow pressure (central venous pressure, CVP), and an external pressure (pleural pressure, PLP). The arrow shows the direction of blood flow. Right, clinical examples illustrating the three zone conditions. Top (condition 1): the inflow pressure drops below the pleural pressure during mechanical pulmonary inflation, which results in complete collapse of the vena cava. This situation is illustrated by examination of a hypovolemic patient. Middle (condition 2): only the outflow pressure is reduced, and pulmonary inflation results in localized collapse at the entry to the atrium. This situation is illustrated by examination after clamping of the inferior vena cava during hepatectomy, which reduces CVP without lowering MSP. Bottom (condition 3): the outflow pressure remains higher than the external pressure, and the vessel remains fully open during pulmonary inflation. This situation is illustrated by examination of the vena cava after volume expansion. INSP: inspiration; EXP: expiration |
We have proposed the use of an SVC collapsibility index calculated as the difference between the maximum expiratory diameter and the minimum inspiratory diameter, divided by the maximum expiratory diameter (figure 6). 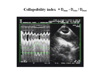
| Figure 6: Measurement of the collapsibility index of the SVC from a longitudinal view (see figure 2), recorded using two-dimensional and M-mode echocardiography. The maximum diameter (Dmax) is observed on expiration, while the minimum diameter (Dmin) is observed at the inspiration plateau. |
This index can be used to predict the response to fluid administration to a mechanically ventilated patient presenting with signs of circulatory insufficiency (4). This evaluation requires a long-axis view of the SVC (longitudinal view) using a multiplane transesophageal probe (figure 2), operating in two-dimensional M-mode. Our measurements in 66 septic shock patients showed that a collapsibility index above 36% predicted, with 90% sensitivity and 100% specificity, a positive response to volume expansion, marked by significant increase in cardiac flow (films 4 and 5) (4). In the same study, we observed a bimodal distribution of collapsibility indices, most patients experiencing complete, or almost complete, inspiratory collapse, or, conversely, presenting with insignificant inspiratory variations in SVC diameter (figure 7). We feel that this confirms the parallel drawn with a Starling resistor, which obeys the all-or-nothing rule. 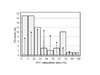
| Figure 7 : Distribution of SVC collapsibility index in 66 patients mechanically ventilated because of septic shock. Most of the patients had an index below 30% or above 60%. The vertical lines indicate the normal distribution. |
Inferior vena cava Echocardiography of the IVC can easily be done by a transthoracic, subcostal approach (figure 8) (5,6). 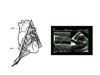
| Figure 8 : Longitudinal view of the inferior vena cava (IVC), recorded using two-dimensional and M-mode echocardiography. The transthoracic probe sensor must be positioned subcostally and slowly turned 90° counterclockwise. RA: right atrium |
Measurement of IVC diameter in different positions differentiates normal subjects from patients with elevated right atrial pressure (7). In their famous study of venous return in the dog, Guyton and collaborators showed that venous return is improved by a moderately negative right atrial pressure, but is hindered by more negative right atrial pressures (8). Guyton explained this in terms of collapse of the IVC at its entry in the thorax, illustrating the inability of a collapsible vessel to transmit negative pressure (8). In work on severe asthma, we provided the first demonstration of the reality of this phenomenon in human subjects (9) (figure 9, film 6). 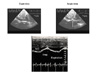
| Figure 9 : Respiratory variations in the IVC in two patients with severe acute asthma. The two-dimensional recording (top) shows the collapse of the IVC on inspiration (arrow) where it crosses the diaphragm. The M-mode recording (bottom) shows the same thing. |
In a spontaneously breathing, healthy subject, cyclic variations in pleural pressure, which are transmitted to the right atrium, produce cyclic variations in venous return, which is increased by inspiration, leading to an inspiratory reduction of about 50% in IVC diameter (figure 10) (5). 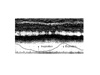
| Figure 10 : Physiological respiratory variations in IVC diameter in a healthy volunteer breathing quietly. IVC diameter decreases on each inspiration. |
When the IVC is dilated, the relation between the diameter and pressure is located on the horizontal part of the curve: respiratory variations in diameter, produced by a low inspiratory pressure, are therefore abolished (figure 11). 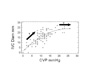
| Figure 11: Simultaneous measurements of the central venous pressure (CVP) and IVC diameter at the end of expiration in 108 mechanically ventilated patients. The relation pressure/IVC diameter is characterized by an initial ascending curve (arrow 1) where the compliance index (slope) does not vary, and an almost horizontal end part where the compliance index progressively decreases, because of the distension. |
This is what is seen in cardiac tamponade (10), and in severe right ventricular failure (6). In a patient requiring ventilatory support, the inspiratory phase induces an increase in pleural pressure, which is transmitted to the right atrium, thus reducing venous return. The result is an inversion of the cyclic changes in IVC diameter, leading to increases in the inspiratory phase and decreases in the expiratory phase (figure 12, film 7). 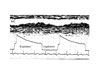
| Figure 12 : Respiratory variations in IVC diameter in a patient on controlled ventilation. IVC diameter increases on each inspiration. |
These variations are also abolished by dilatation of the vena cava, indicating high right atrial pressure for the same reason as before (figure 11). The respiratory variations in IVC diameter in a mechanically ventilated patient are therefore only observed when right atrial pressure is normal, that is low. In a patient presenting with signs of circulatory insufficiency, this finding may indicate hypovolemia. Measurement of IVC diameter in a patient receiving mechanical ventilation does not accurately predict right atrial pressure (11). Absence of respiratory variations in IVC diameter in a mechanically ventilated patient presenting with signs of circulatory insufficiency suggests that volume expansion will be ineffective in 90% of cases (12). Feissel and collaborators were the first to propose using respiratory variations in IVC diameter to predict the response to filling in a mechanically ventilated patient (12). By expressing the respiratory variability in IVC diameter as the difference between the value of the maximum inspiratory diameter and the minimum expiratory diameter, divided by the mean of the two values, these authors showed that a 12% increase during the inspiratory phase differentiated patients likely to respond to vascular filling, in terms of increased cardiac flow, from those who would not respond, with a positive predictive value of 93% and a negative predictive value of 92% (12). The great merit of this work is that it proposes a dynamic, noninvasive parameter to evaluate the potential benefit of volume expansion. Moreover, the examination of the IVC is particularly easy and can be done by someone with limited experience in echocardiography. Feissel’s findings were simultaneously confirmed by our team (figure 13, films 8, 9, 10) (13). 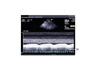
| Figure 13 : M-mode recording of variations in IVC diameter in a mechanically ventilated septic patient with circulatory insufficiency. The size of the variations suggests hypovolemia and the need for vascular filling. |
One question remains though: is this index still valid when the patients have a high abdominal pressure which limits variations in IVC diameter? Another phenomenon observed in the IVC of a mechanically ventilated patient is retrograde flow, which is unrelated to tricuspid regurgitation and is caused by the cyclic compression of the right atrial wall by the lung (film 11). This compression forces the blood in the atrium backwards, especially when it occurs during cardiac systole, whereas the closed tricuspid valve prevents anterograde flow (14). This retrograde flow is a major source of inaccuracy when measuring cardiac flow by the thermodilution method in a mechanically ventilated patient (14). In conclusion, ultrasound examination of the vena cavae provides new, precise and easily determined indices of the expected response to volume expansion in a mechanically ventilated patient with circulatory insufficiency (figure 14). 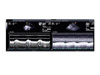
| Figure 14: Ultrasound of SVC (left) and IVC (right) in the same mechanically ventilated hypotensive patient. Transesophageal echocardiography shows partial collapse of the superior vena cava on inspiration, whereas transthoracic echocardiography using a subcostal view shows enlargement of the IVC on inspiration. In this patient, volume expansion restored blood pressure and abolished the variations in diameter of the venae cavae. TP: tracheal pressure. |
References 1 Mellander S, Johanson B (1968) Control of resistance, exchange and capacitance functions in the peripheral circulation. Pharmacol Rev 20:117-196 2 Rushmer R (1970) Peripheral vascular control. In Rushmer R, Cardiovascular Dynamics, WB Saunders, Philadelphia, 1970, pp: 113-147 3 Vieillard-Baron A, Augarde R, Prin S, Page B, Beauchet A, Jardin F (2001) Influence of superior vena caval zone conditions on cyclic changes in right ventricular outflow during respiratory support. Anesthesiology 95:1083-1088 4 Vieillard-Baron A, Chergui K, Rabiller A, Peyrouset O, Page B, Beauchet A, Jardin F (2004) Superior vena caval collapsibility as a gauge of volume status in ventilated septic patients. Intensive Care Med 30:1734-1739 5 Mintz G, Kotler M, Parry W, Iskandrian A, Kane S (1981) Real-time inferior vena caval ultrasonography: normal and abnormal findings and its use in assessing right heart function. Circulation 64:1018-1025 6 Moreno F, Hagan A, Holmen J, Pryor A, Strickland R, Castle H (1984) Evaluation of size and dynamics of the inferior vena cava as an index of right-sided cardiac function. Am J Cardiol 52:579-585 7 Nakao S, Come P, McKay R, Ransil B (1987) Effects of positional changes on inferior vena caval size and dynamics and correlations with right-sided cardiac pressures. Am J Cardiol 59:125-132 8 Guyton A, Lindsey A, Abernathy A, Richardson T (1957) Venous return at various right atrial pressures and the normal venous return curve. Am J Physiol 189:609-615 9 Jardin F, Farcot JC, Boisante L, Prost JF, Guéret P, Bourdarias JP (1982) Mechanism of paradoxical pulse in bronchial asthma. Circulation 66:887-894 10 Himelman R, Kircher B, Rockey D, Schiller N (1988) Inferior vena cava plethora with blunted respiratory response: a sensitive echocardiographic sign of cardiac tamponade. J Am Coll Cardiol 12:1470-1477 11 Jue J, Chung W, Schiller N (1992) Does inferior vena cava size predict right atrial pressure in patients receiving mechanical ventilation. J Am Soc Echocardiogr 5: 613-619 12 Feissel M, Michard F, Faller JP, Teboul JL (2004) The respiratory variation in inferior vena cava diameter as a guide to fluid therapy. Intensive Care Med 30: 1834-1837 13 Barbier C, Loubières Y, Schmit C, Hayon J, Ricôme JL, Jardin F, Vieillard-Baron A (2004) Respiratory changes in inferior vena cava diameter are helpful in predicting fluid responsiveness in ventilated septic patients. Intensive Care Med 30:1740-1746 14 Jullien T, Valtier B, Hongnat JM, Dubourg O, Bourdarias JP, Jardin F (1995) Incidence of tricuspid regurgitation and vena caval backward flow in mechanically ventilated patients. A color Doppler and contrast echocardiographic study. Chest 107:488-493 |
|
|
| |
|


)
)
)
)
)
)
)
)
)
)
)
)
)
)